
Artificial Intelligence
A construction-specific business intelligence platform that sits on top of your existing tech stack to provide real-time risk analytics and performance insights across your entire portfolio.
PROJEXION

Construction companies struggle with fragmented data across multiple systems like Procore, Microsoft Project, and Sage that don't communicate effectively with each other. Executives spend days manually compiling reports while project teams submit redundant requests to overworked data teams, creating bottlenecks throughout the organization. By the time dashboards are finally built in tools like Power BI—a process that often takes months—the information is already outdated and no longer actionable. Meanwhile, critical risks hide in siloed systems while teams waste three or more days per month reconciling endless Excel reports, creating a cycle of reactive rather than proactive management.
Projexion integrates directly with existing construction software to aggregate and analyze data in real-time, eliminating the manual compilation nightmare. Using a proprietary componentized analytics engine—similar to Unreal Engine 5's approach to game design—complex calculations that would take weeks to build manually can be deployed across an entire portfolio in days rather than months. Executives get immediate red, yellow, and green risk flags at the portfolio level and can drill down to granular project details in seconds, transforming decision-making from reactive guesswork to proactive insight.
Projexion focuses primarily on the during-construction phase, though data collection spans from pre-construction through post-construction to provide complete project lifecycle visibility. The platform targets general contractors and owner-developers in the mid-to-large segment with $500M-$10B+ in annual revenue. Specific use cases include portfolio management, schedule analytics, financial oversight, document control, and compliance monitoring—essentially becoming the central nervous system for construction operations at scale.
Pain point addressed: Executives waste hours each week reviewing 30+ projects individually to identify problems.
Solution:
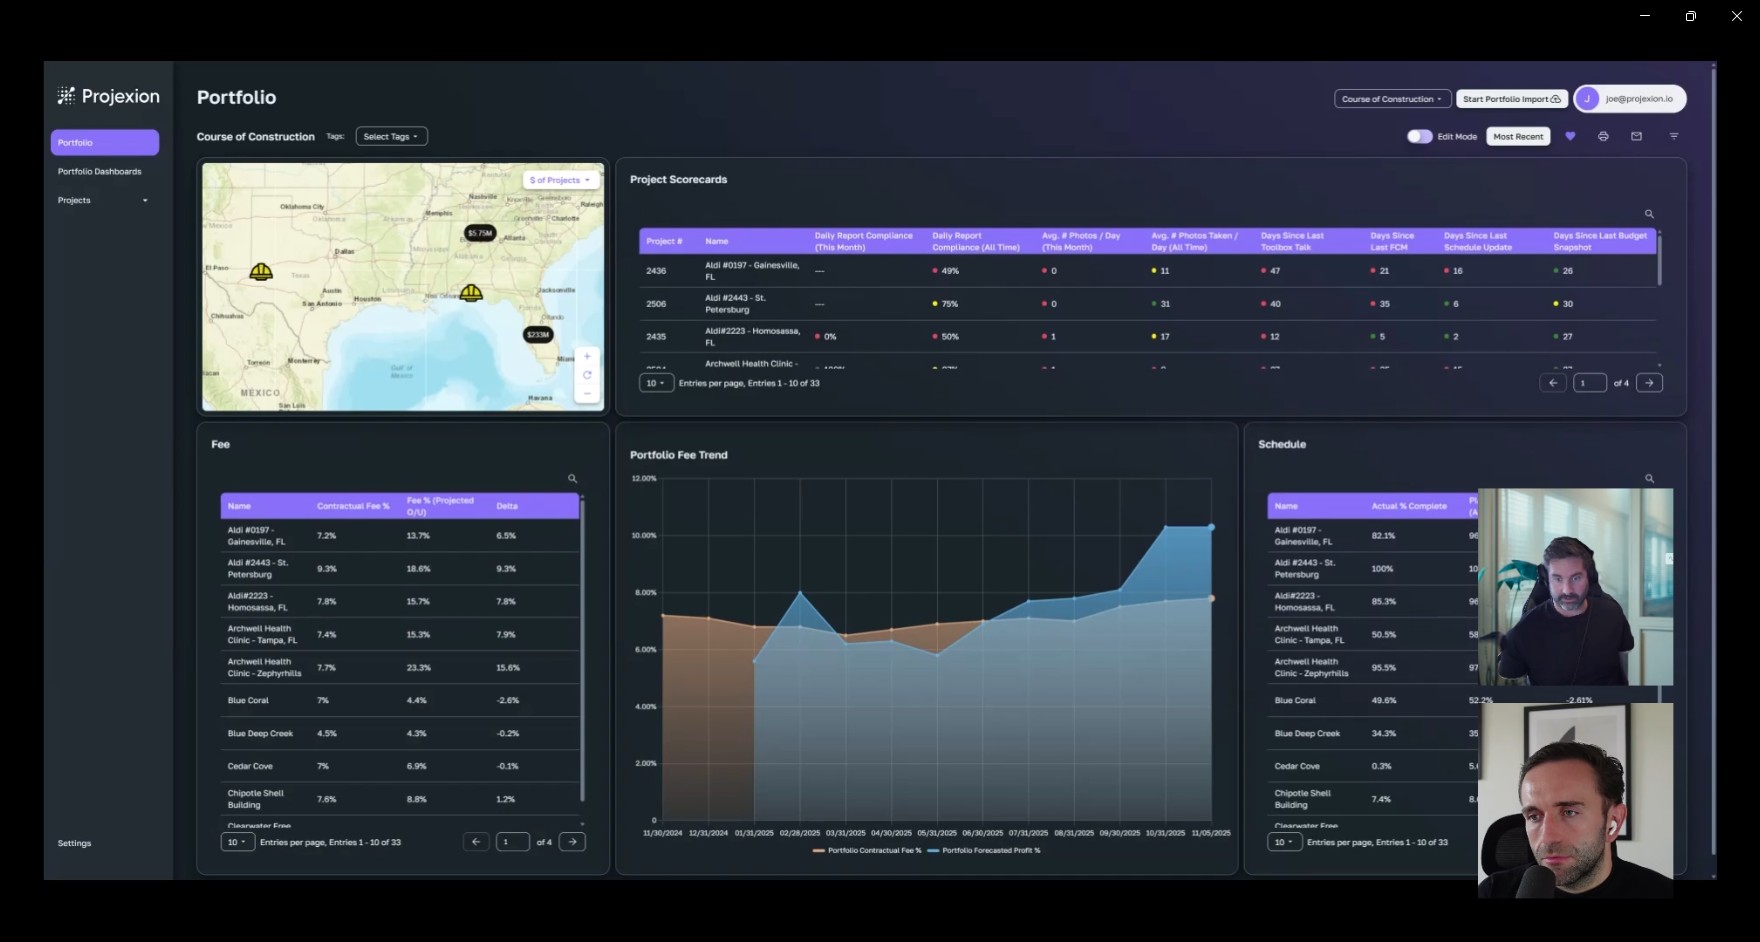
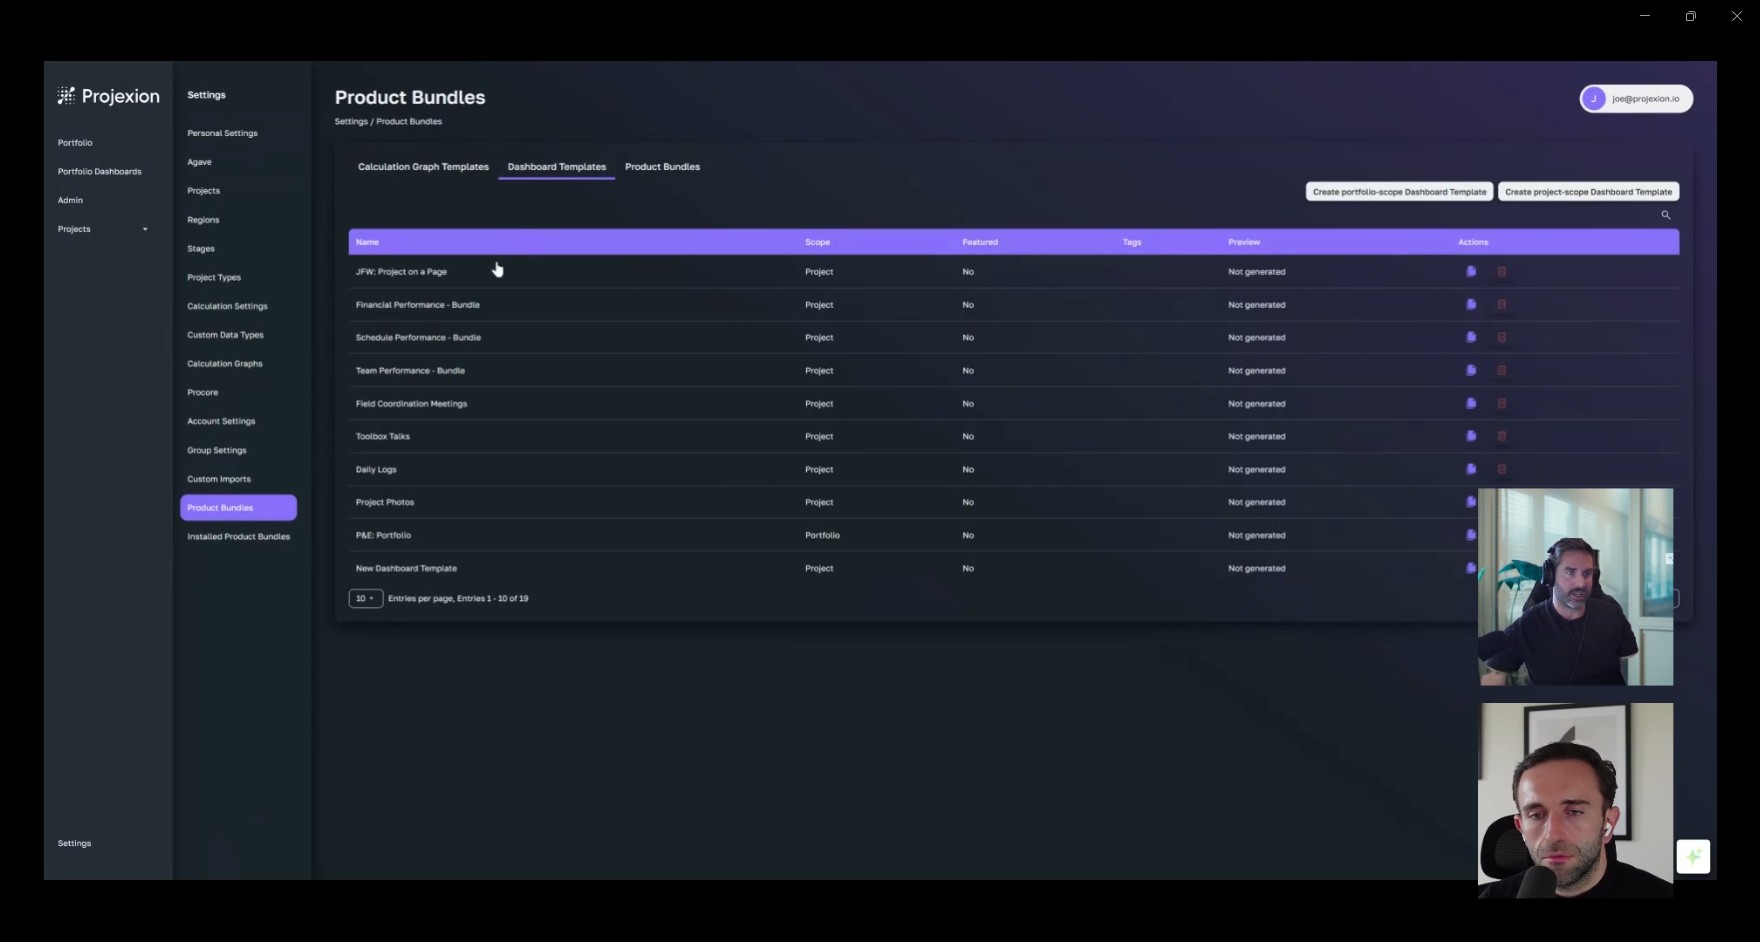
The platform offers pre-built modules covering scheduling, financials, team performance, document control, and safety and quality. Scheduling insights include actual versus planned completion, critical path analysis, and float compression. Financial modules track budget performance, contingency burn, and contractual fees against projections. Team performance is evaluated through compliance rates and month-over-month trends, while document control focuses on response times, late items, and historical performance. Safety and quality modules enable compliance tracking with custom-defined thresholds.
How it works:
Dashboard displays custom-defined risk categories with immediate red/yellow/green flags. Executives scan portfolio views on Monday morning, jump directly to projects needing attention, and skip the 29 that are performing well.
Pain point addressed: Building custom calculations in Power BI requires starting from scratch for each project. Changes to one dashboard don't cascade to others.
Solution:
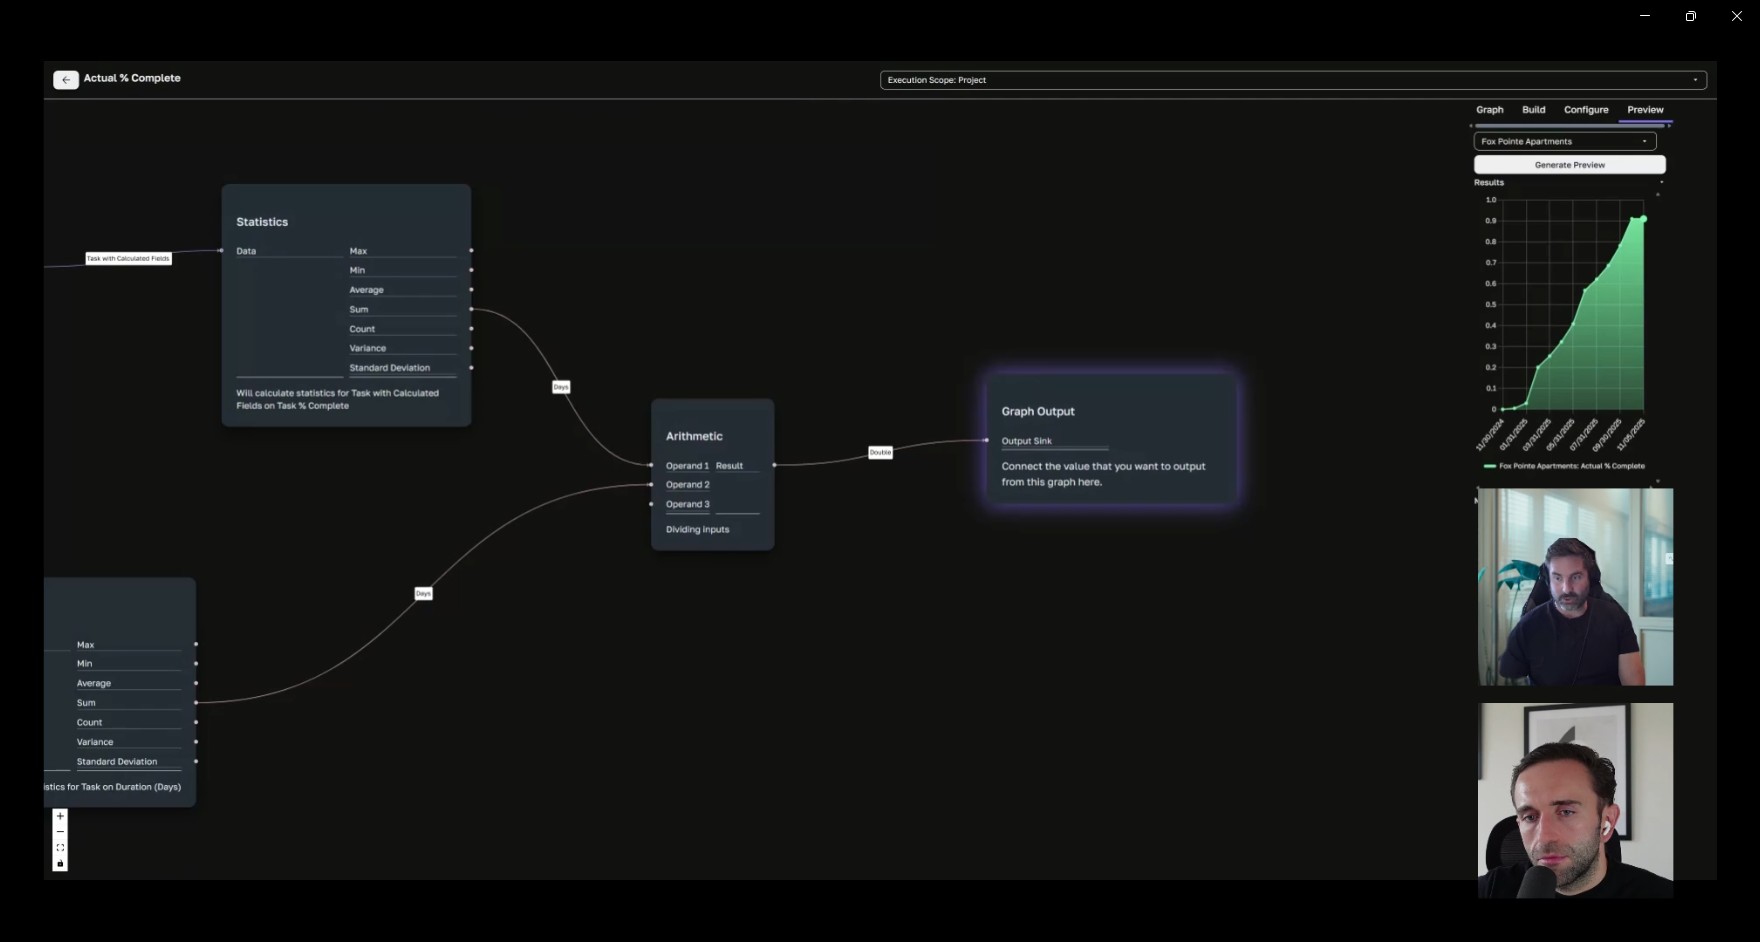
The platform provides a visual, no-code calculation builder made up of pre-built components. For example, an “Actual Percent Complete” calculation pulls source data directly from scheduling software, automatically cleans duplicate entries, multiplies each task’s percent complete by its duration, and then sums completed days divided by total duration to generate an accurate schedule completion metric.
How it works:
Once a calculation is built, it becomes a reusable "node" that can be instantly deployed across all projects in the portfolio. Tweaks are made through dropdown menus—no coding required. Think "Excel on steroids with visual flow mapping."
Pain point addressed: Traditional BI tools show snapshots—"7 items open, 5 late"—but don't reveal if you're improving or declining over time.
Solution:
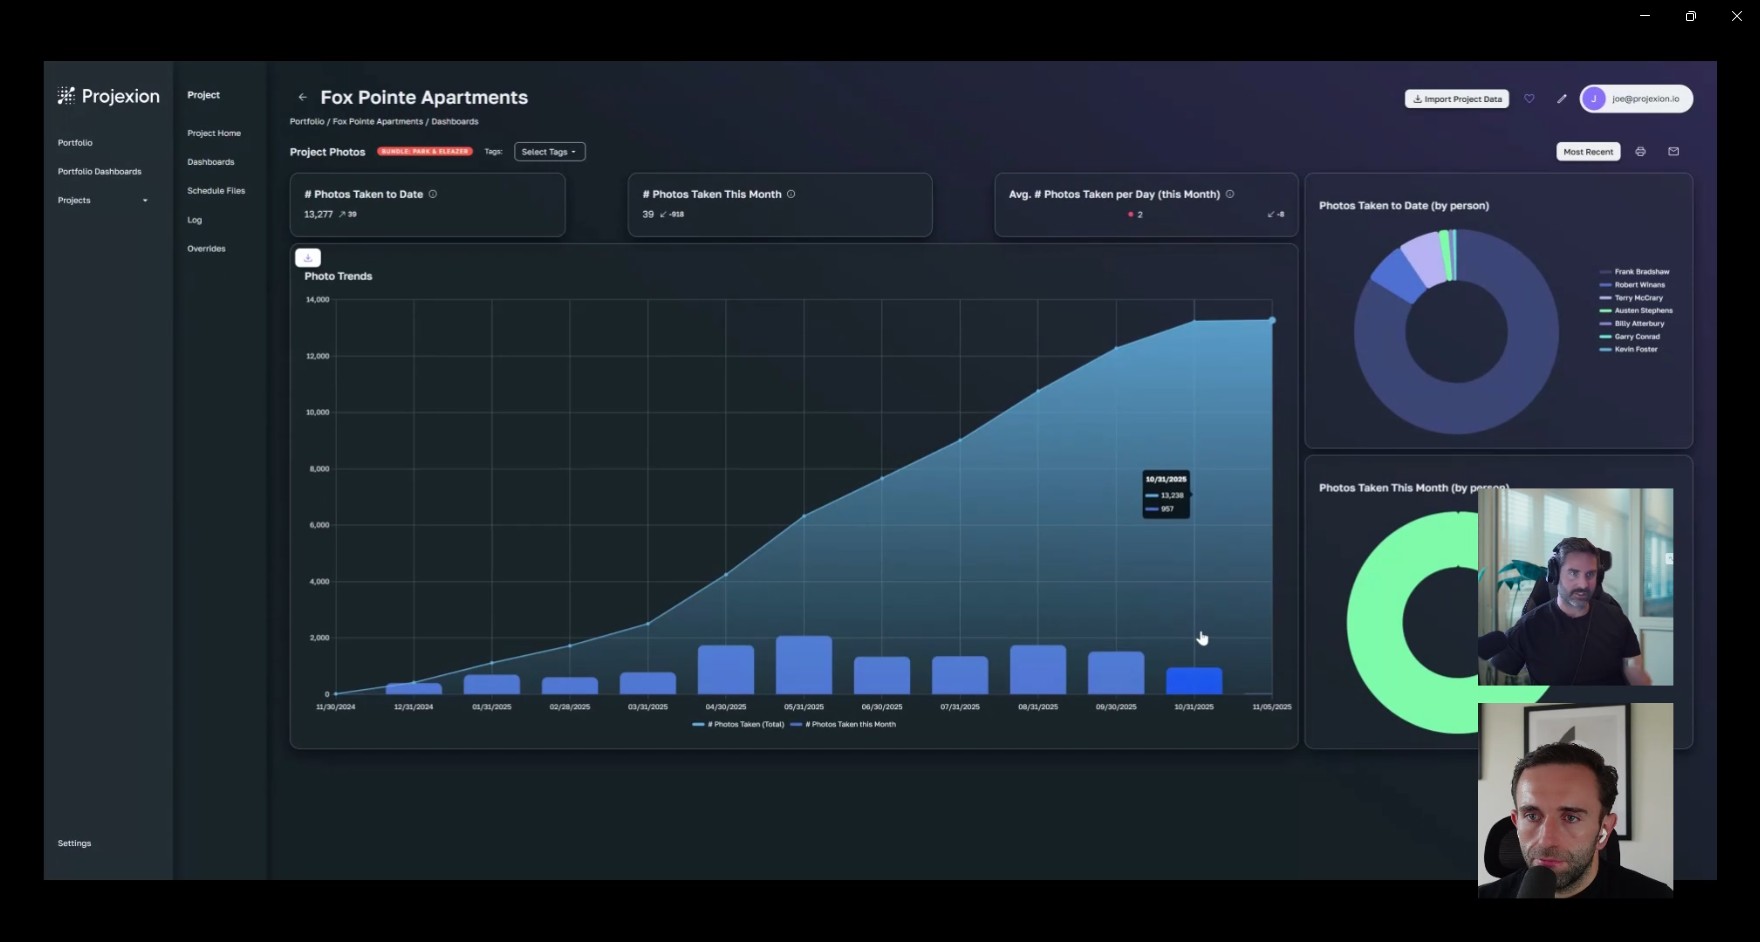
Every metric includes built-in time-series analysis that compares performance from six months ago to today, displays trend lines that clearly indicate improvement or decline, and highlights correlations between different risk factors, such as late submittals impacting budget performance. The system also tracks photo documentation compliance rates by team member over time, adding behavioral accountability to operational metrics.
Real-world example:
Client tracked contractor hitting only 20% of critical path activities on time for months. As schedule compressed, Projexion flagged escalating risk. The contractor claimed everything was fine. Eight months later, the contractor requested a 3-month delay + $1M+ in general conditions. Client used Projexion's historical data to deny the claim and pursue liquidated damages instead. ROI: Saved $1M+ on a $10K/year module.
Pain point addressed: Data lives in Microsoft Project, Procore, Sage 300/Intacct, and Excel files scattered across drives. Manual reconciliation takes days.
Solution:
The platform offers direct integrations with major industry systems such as Procore, Microsoft Project, Sage 300, and Sage Intacct. For Procore users, single sign-on automatically pulls in all associated projects without manual setup. Standard modules can be onboarded in as little as 30 minutes, while more customized deployments are typically completed within three months.
How it works:
One-click import for portfolio. The system automatically pulls schedules, budgets, RFIs, submittals, change orders, photos, and more.
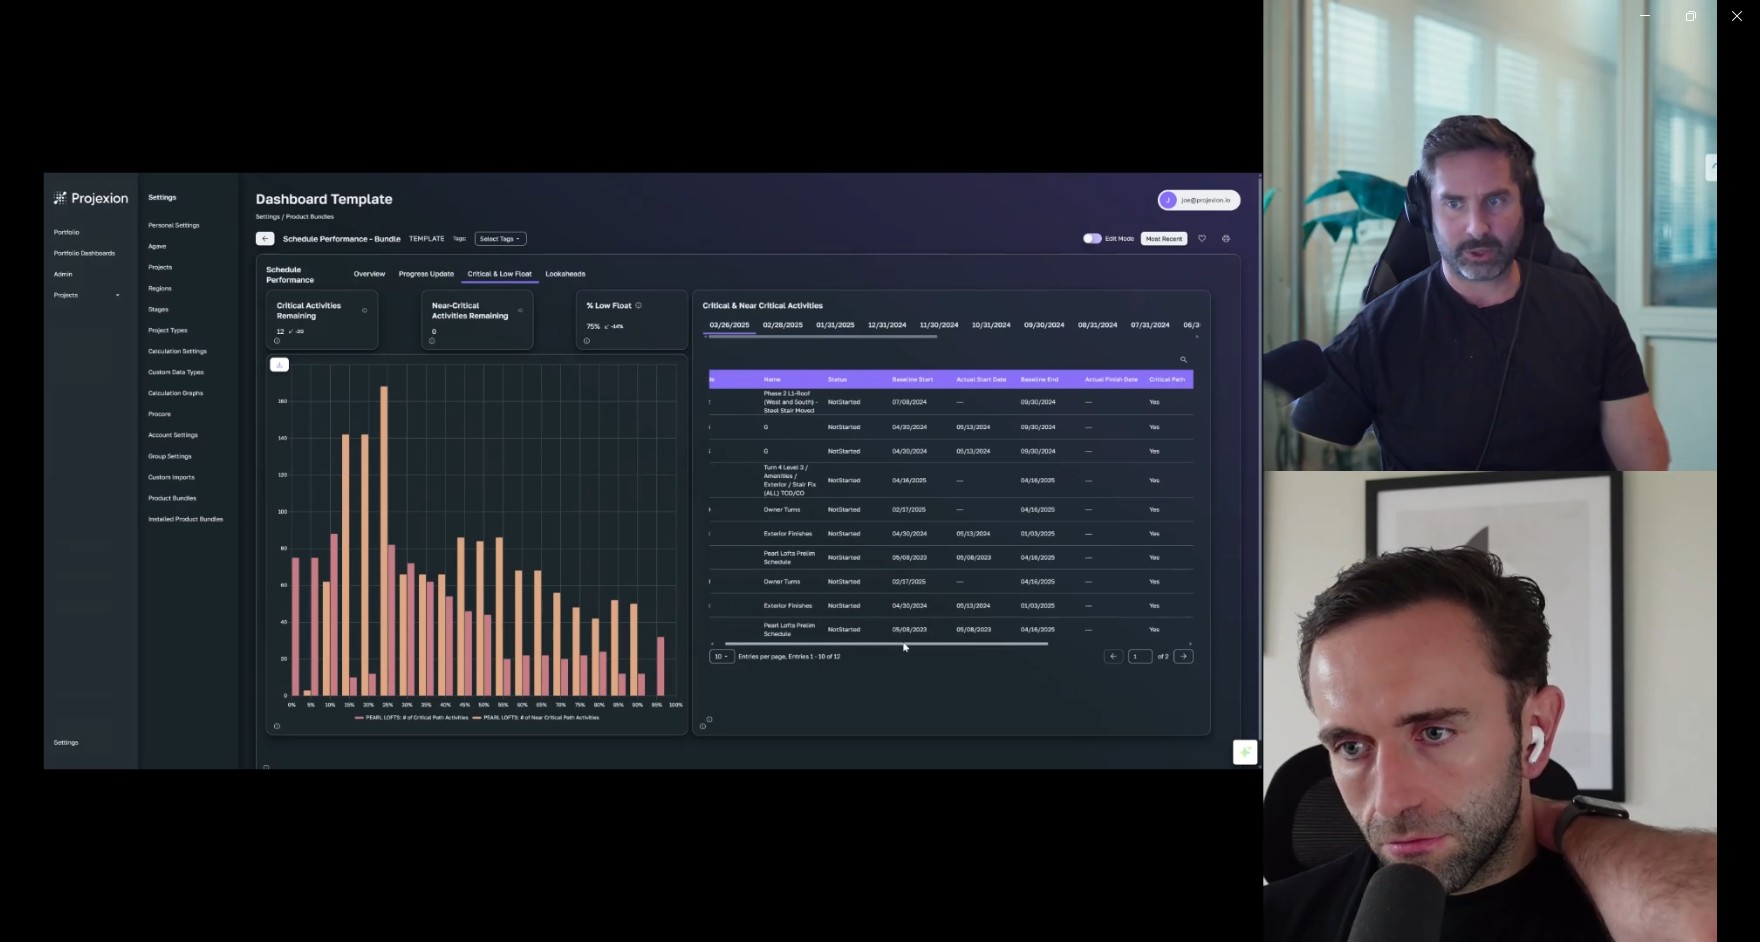
Schedule Performance Module ($10K/year):
This module focuses on proactive schedule risk management by tracking schedule update frequency, monitoring critical and near-critical activities, and analyzing float to flag situations where a single missed day eliminates all buffer. It compares baseline schedules against actual progress and correlates job cost data to identify when spending is moving too fast or too slow relative to progress. Three-week look-aheads are generated directly from the contract schedule, eliminating the need for separate Excel files that often create conflicting sources of truth.
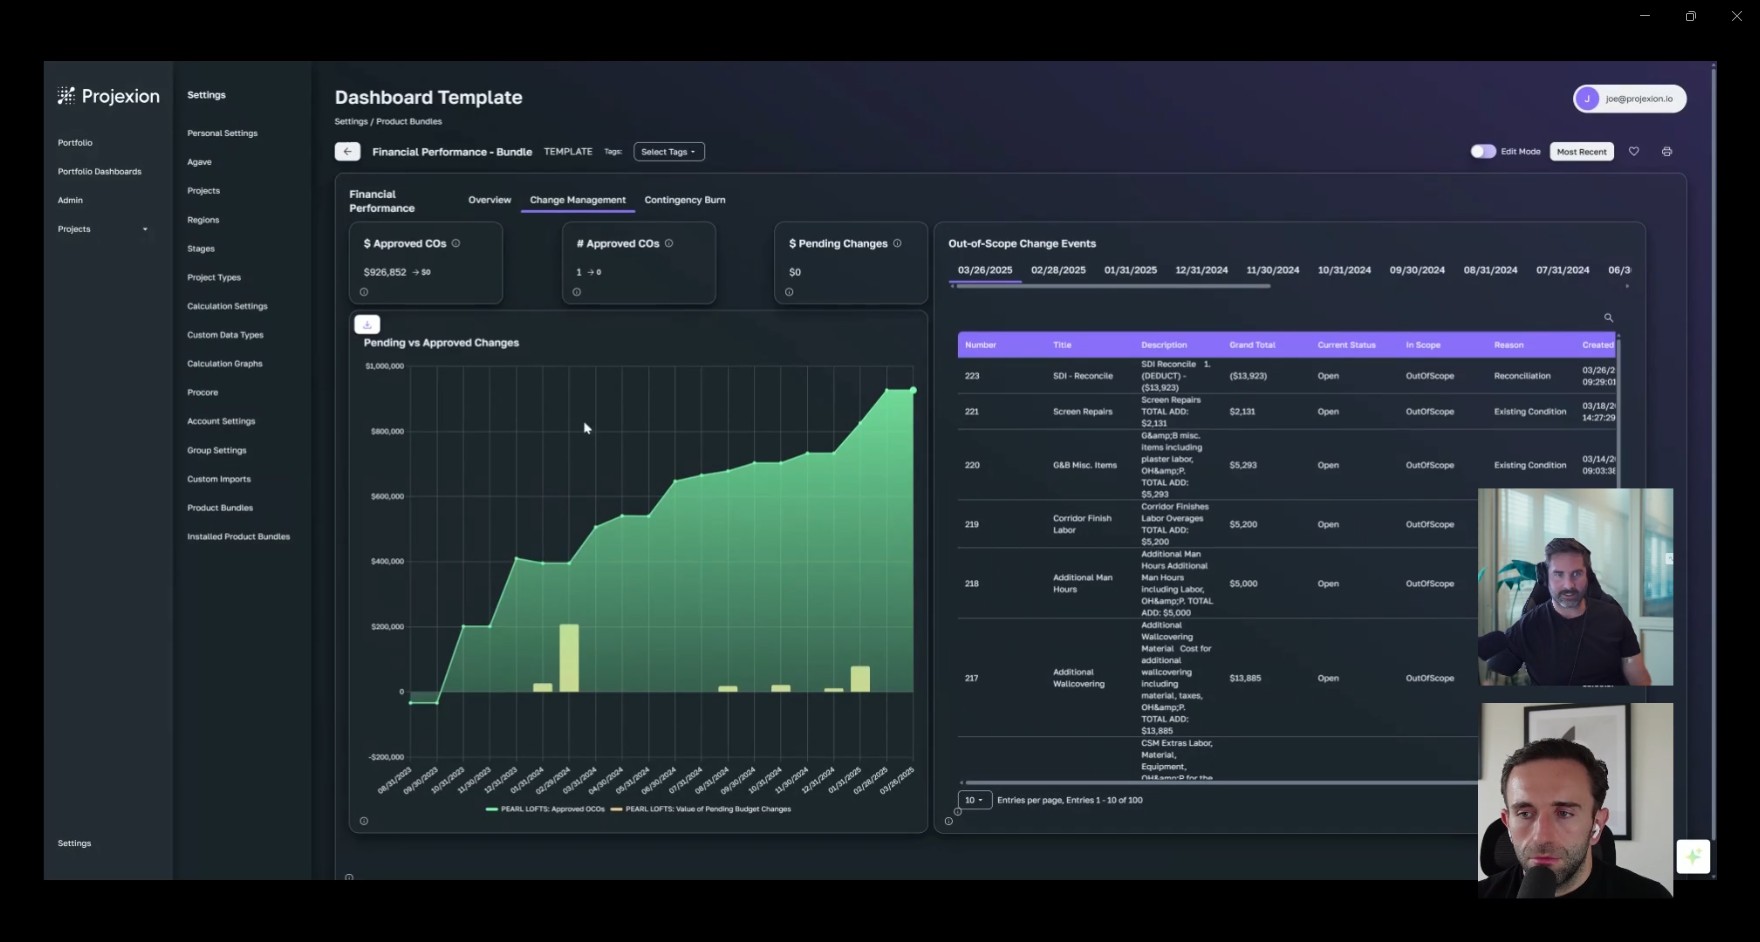
Financial/WIP Reporting Module ($10K/year):
Pain point: Controller spends 3 days/month reconciling Excel reports across projects.
Solution:
Automated WIP reports continuously track budget versus actuals, monitor contingency burn rates, manage change orders, and highlight deltas between contract fees and projections. This automation returns approximately three days per month to the controller while also saving additional hours across project teams.
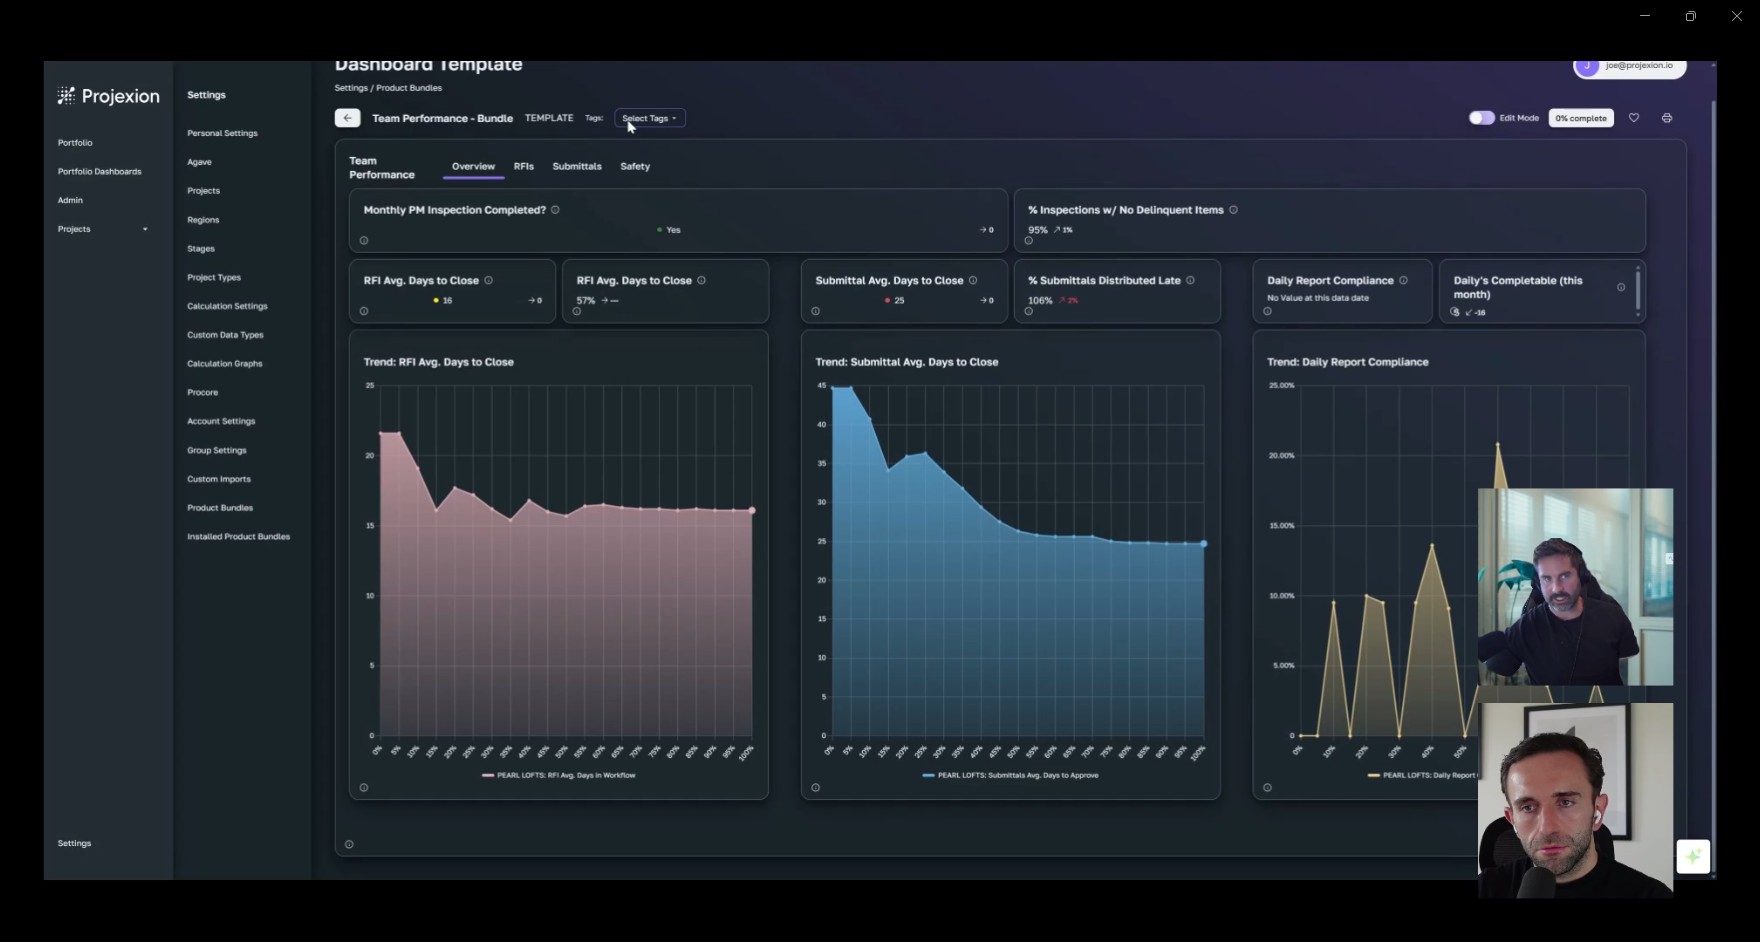
Document Control Module ($10K/year):
This module provides visibility into document workflows by tracking the average time to close items within the team’s control, the percentage of late responses, and response times for architects and subcontractors. Historical performance trends are analyzed, and predictive risk flags are raised when response times begin to slip, enabling early intervention.
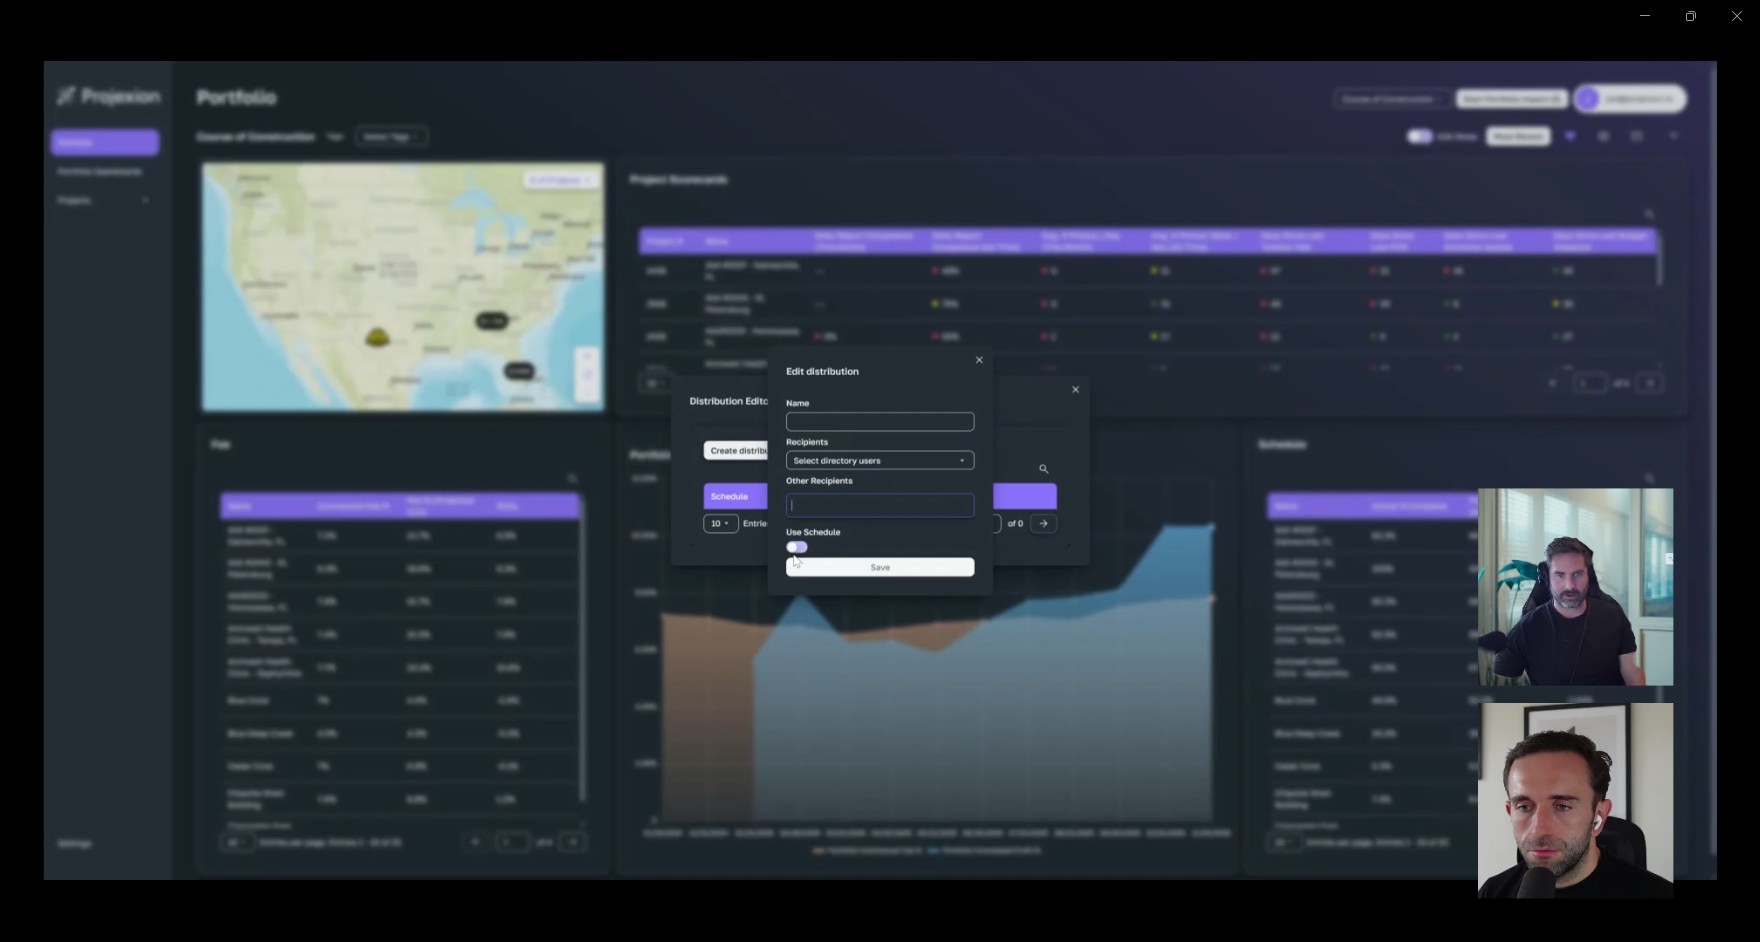
Pain point addressed: Preparing monthly reports for owners/architects consumes hours of PM time every week.
Solution:
Preparing monthly reports for owners and architects typically consumes hours of project manager time each week. This is addressed through automatic dashboard distribution on weekly, monthly, or custom schedules. Recipients receive read-only access to live, interactive dashboards rather than static PDFs, allowing stakeholders to explore historical performance on their own. In practice, this enables use cases such as architects identifying that they are averaging 20-day response times and proactively allocating additional resources to improve performance.
Primary: General contractors ($500M-$10B annual revenue)
Secondary: Owner-developers with large project portfolios


Tampa Florida, US Headquarters
Timeline:
Approach:
.avif)


Time Savings (Quantifiable):
Strategic Value (Unquantifiable):
$1.2 Million
Seed
Undisclosed
.avif)