The Google Maps of the underground—a living, breathing utility database that proactively maps public and private utilities across the entire country using AI-powered record digitization and machine learning-based surface feature detection.
When performing feasibility studies, pursuing proposals, or planning routes, teams are forced into a fragmented and time-consuming workflow. They begin by submitting design tickets, where available, and often wait days for responses. In parallel, they chase down utility owners, many of whom never respond without repeated follow-ups. Information arrives in a scattered manner, frequently as paper documents that must be manually digitized. To fill in missing details, teams search multiple GIS websites and hunt for as-built drawings from various sources. All of this data then has to be compiled and converted into a usable digital format, consuming significant labor hours, and if time and budget permit—which is often not the case—site investigations are conducted to validate findings.
Result: Weeks of research, hundreds of labor hours, incomplete information, and delayed project timelines—all to answer the basic question: "What utilities are underground here?"
How 4M Analytics changes it:
4M proactively collects, digitizes, and geotagges utility records from regional sources (CDOT, city departments, DOTs, GIS databases) before you need them. When you draw a project boundary, you instantly receive power, communications, gas, sewer, and water line data with metadata (installation dates, sizes, materials). AI-powered aerial and street-level imagery analysis automatically identifies and maps surface features (manholes, poles, valves, hydrants) to validate record accuracy—all delivered in hours instead of weeks.
Area of Focus:
Primary users: Civil engineering firms, general contractors, EPCs
Project phases: Feasibility, pursuit/proposal, route planning, design, construction planning
Geographic scope: Currently 14 of 50 US states mapped; expanding to full national coverage
Key Features
1. Instant Multi-Utility Record Access
Pain point addressed: Tracking down utility owners, waiting for responses, digitizing paper documents, and assembling data from scattered sources consumes weeks per project.
Solution:
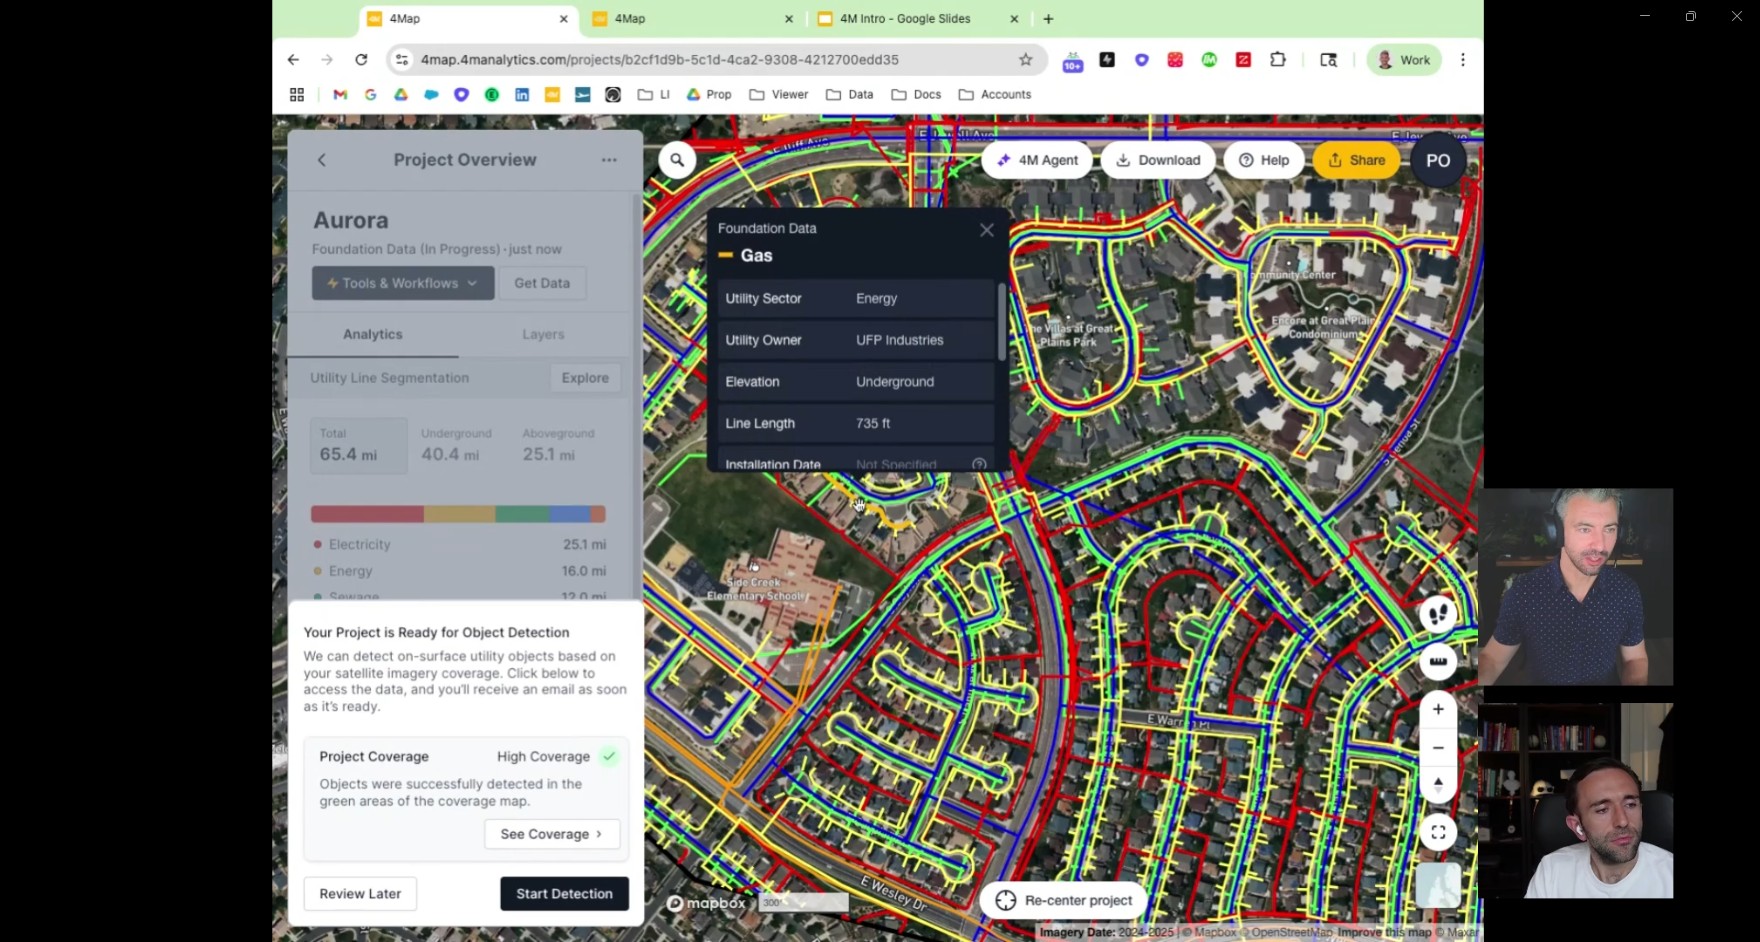
Users draw a project boundary directly on the map interface and instantly receive a comprehensive view of subsurface and overhead infrastructure, including power lines, communications networks, gas lines, sewer systems, and water distribution assets.
How it works:
The platform proactively collects raster documents such as as-builts and construction drawings from regional sources and aggregates GIS databases from cities, counties, and state agencies. All data is geotagged, digitized, and unified into a single “map of maps,” enriched with metadata such as installation dates, pipe or cable sizes, materials, and asset ownership.
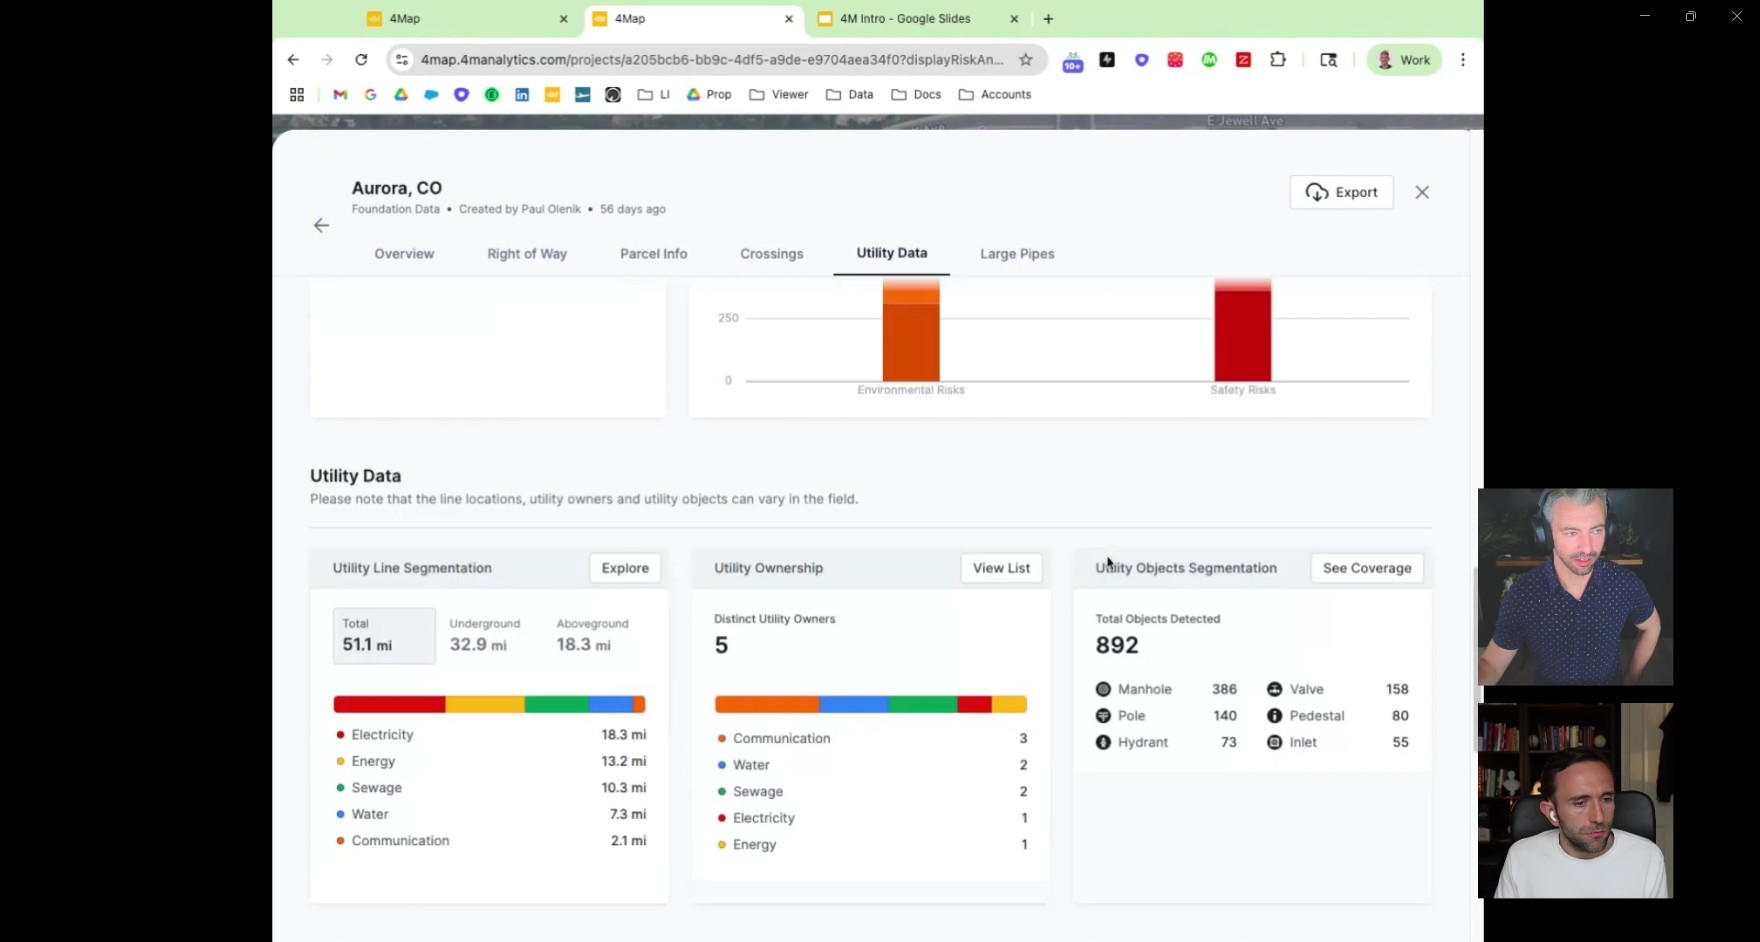
Real-world example (Aurora, Colorado): User needs utilities for highway widening project. Draws project boundaries around the neighborhood. Within seconds, receives comprehensive utility overlay showing all five utility types—information that would have required contacting multiple utility owners, waiting days for responses, and manually digitizing paper maps.
2. AI-Powered Surface Feature Detection
Pain point addressed: Record lines can be inaccurate—relocated utilities, installation variations, or outdated as-builts mean you can't trust the map alone. Traditional validation requires expensive site surveys.
Solution:
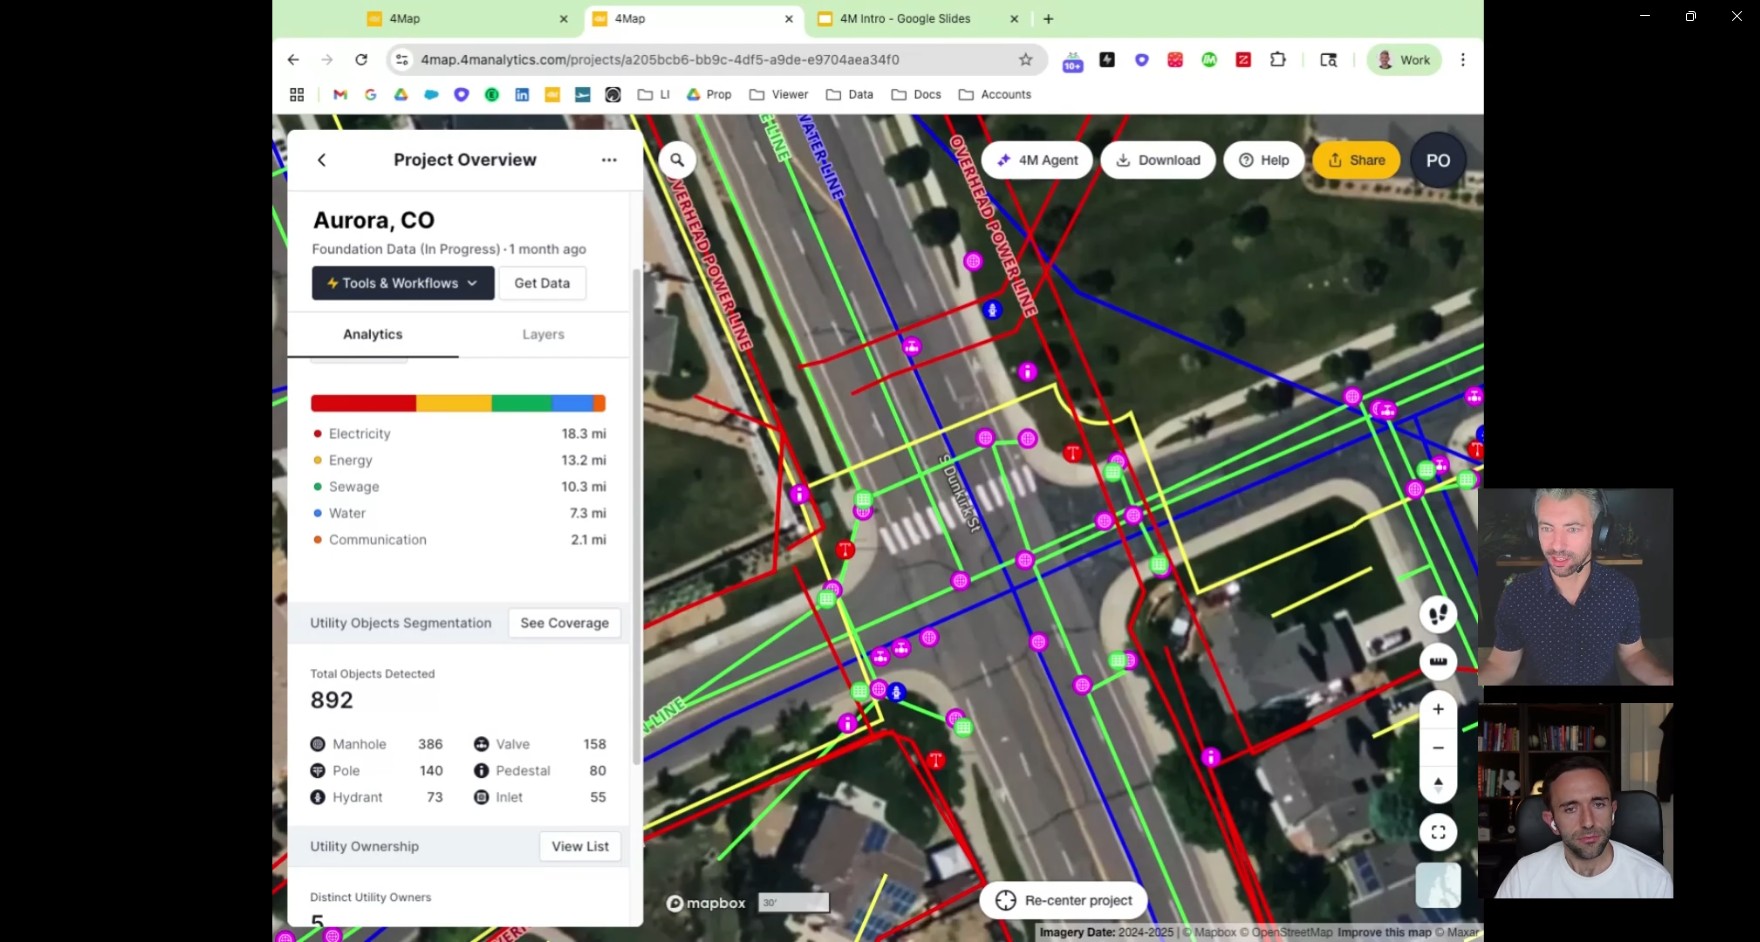
Machine learning is trained to identify surface features from aerial and street-level imagery. Using this technology, 386 manholes are detected and mapped, 158 valves are identified with precise locations, 140 poles are cataloged, and hydrants, inlets, control boxes, and more are automatically recognized.
How it works:
The user creates a project in the platform, and 4M simultaneously collects current aerial and street-level imagery. Machine learning algorithms scan the imagery to identify and classify surface features. Within hours, the project returns with a visual verification layer overlaid on record lines. The user can zoom to any feature and see actual photo evidence.
Validation benefits:
This process allows verification of record line accuracy by correlating with visible surface features, identification of utilities not shown in records (undocumented relocations), distinction between above-ground versus underground infrastructure, and validation of whether lines are power or communications based on pole equipment.
Real-world example (Airport project): Client won major airport job where traditional surveying would require shutting down runways and terminals—operationally impossible and prohibitively expensive. Using 4M's surface feature detection, they identified manholes and other access points to map runway utilities without any site access or operational disruption.
3. Layered Contextual Data
Pain point addressed: Utility data is useless without context—you need parcels for easement analysis, topography for grading, floodplains for permitting, and right-of-way boundaries for cost estimation.
Solution:
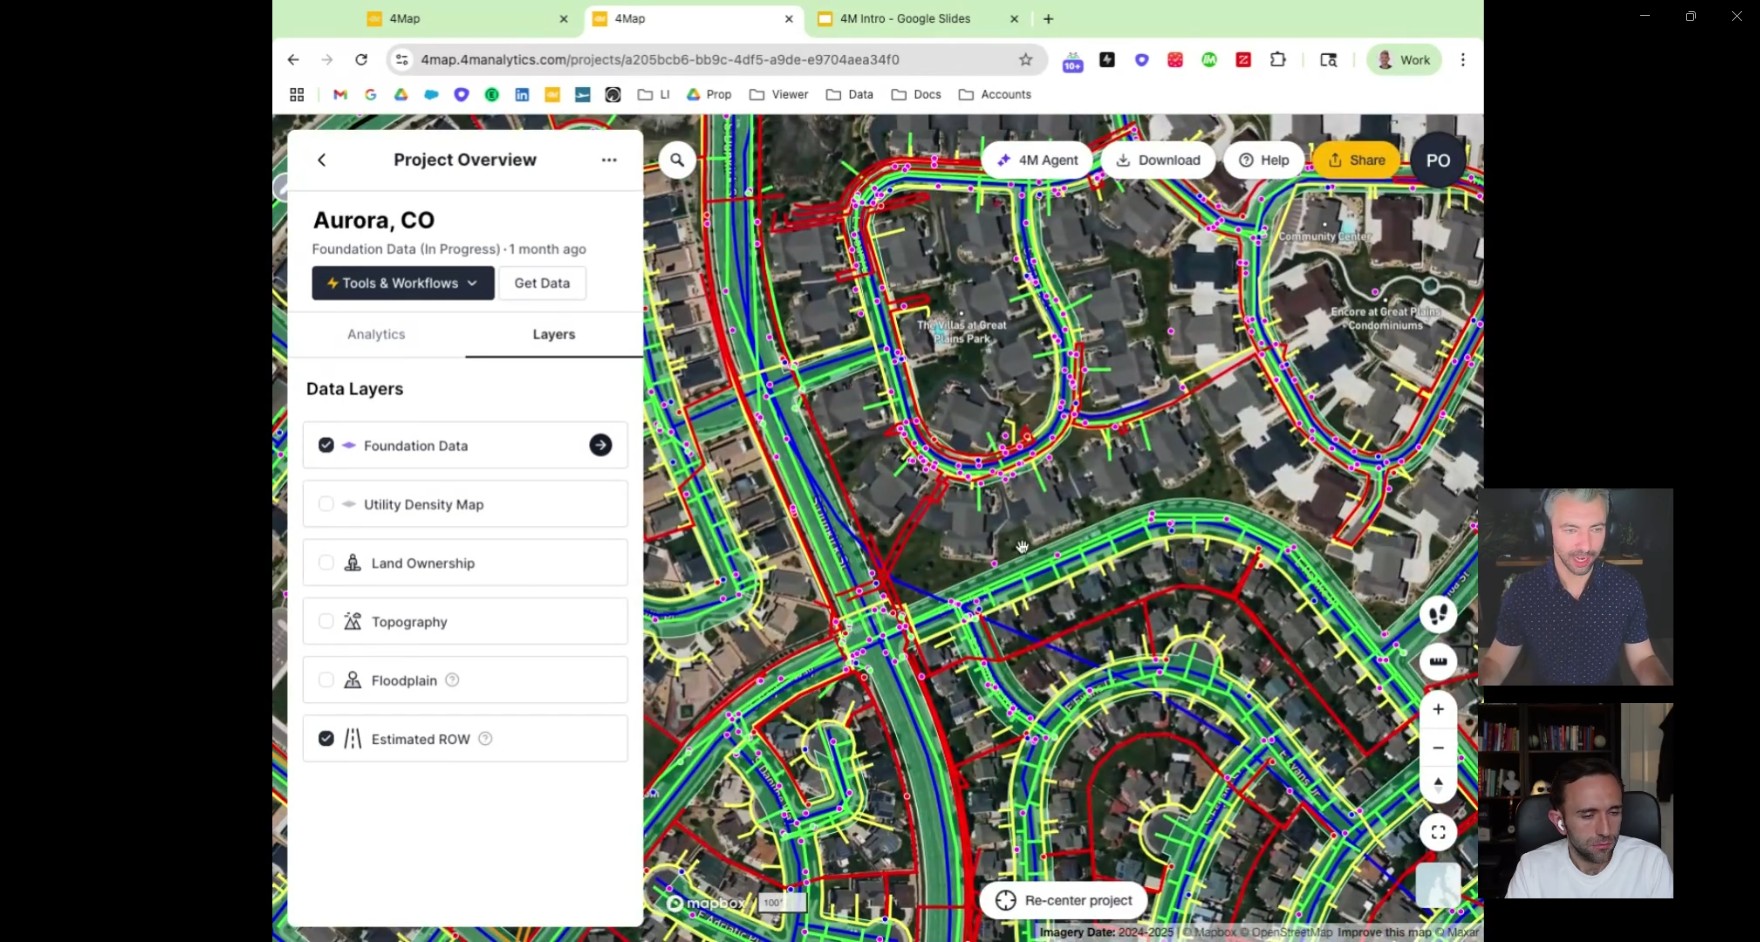
The platform automatically includes critical planning layers, eliminating the need for manual searches. Parcels provide property boundaries without having to access city databases. Estimated right-of-way is included, which is critical for DOT and municipal projects. Topography data provides elevation information for design purposes, and floodplain layers help identify regulatory constraints.
How it works: All layers automatically included when viewing utility map—no separate data hunts, no manual overlay assembly.
4. Utility Routing & Conflict Analysis
Pain point addressed: Comparing route alternatives requires manual conflict counting, easement estimation, and cost projection—taking days per analysis.
Solution:
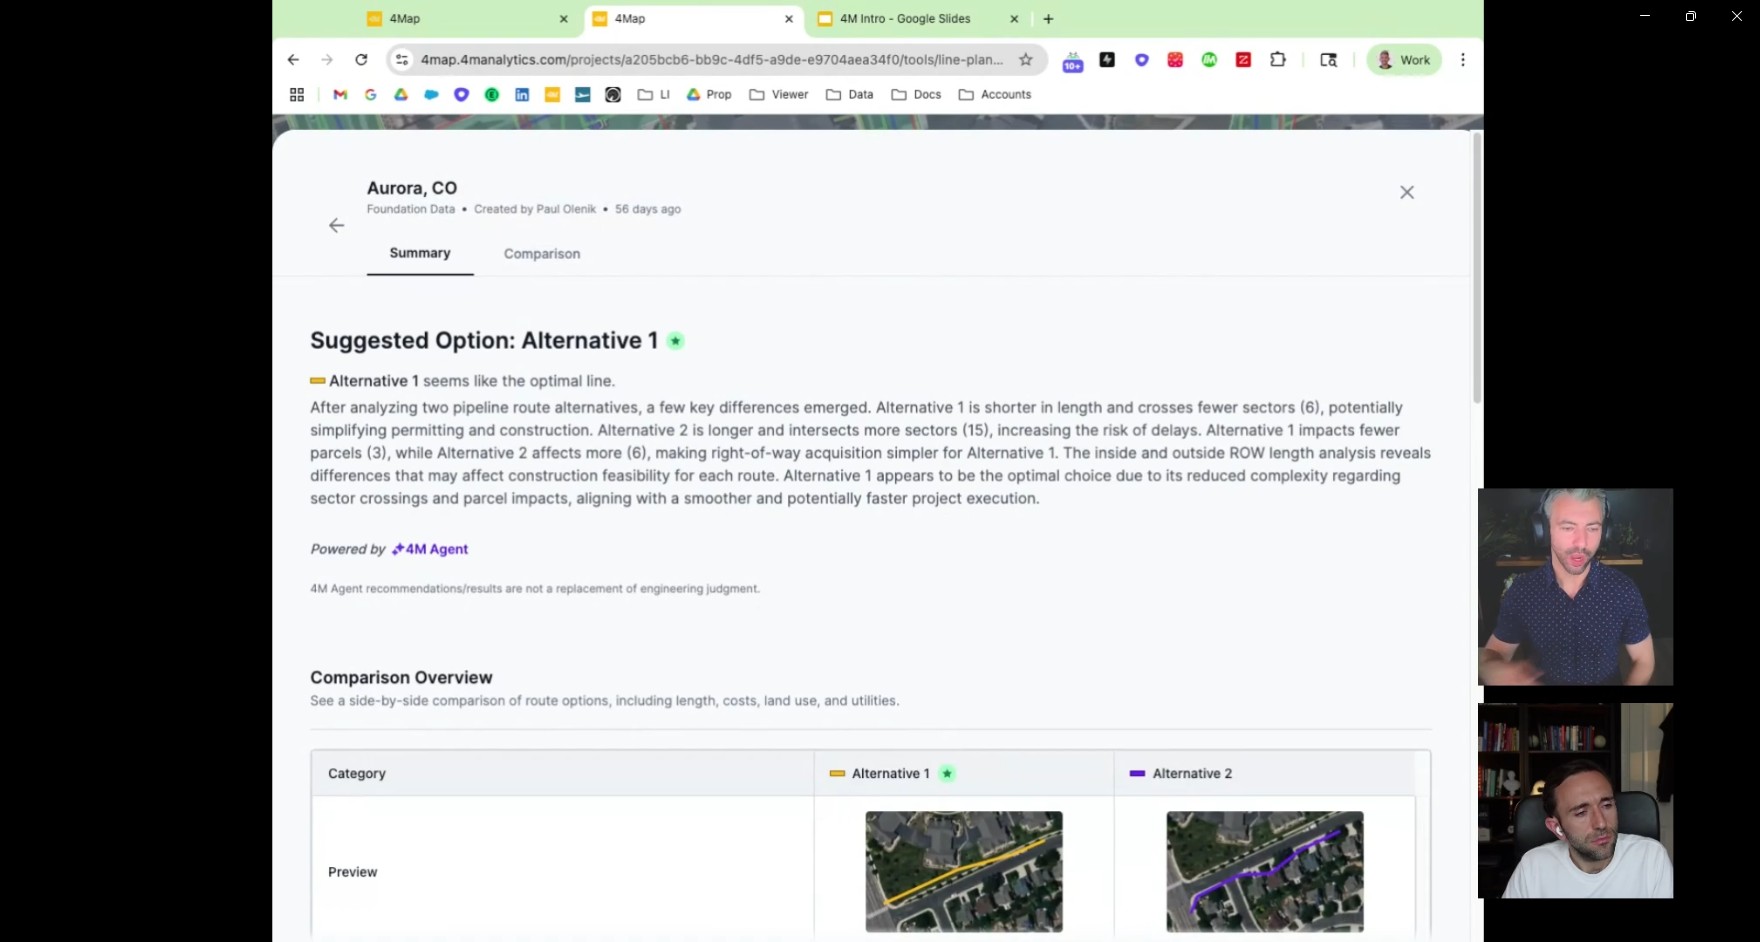
The platform provides an interactive routing tool with automated pros and cons comparison. In a typical workflow, the user draws two alternative water line routes, such as the left side of the street versus the right side, and specifies the utility type (water) and material (aluminum). The system then instantly generates a comparison report showing parcel impacts, including the number of properties affected, utility crossings and conflicts with existing infrastructure by type, right-of-way analysis indicating the percentage in or out of ROW, easement requirements for parcels needing acquisition, and cost implications with a relative expense comparison.
Real-world use case (Undergrounding program): Large utility client planning massive overhead-to-underground power conversion needed to identify where existing overhead power intersects with underground water lines (major cost/complexity driver). Using 4M's filtering tools, they mapped every intersection point across the service territory, enabling strategic prioritization of undergrounding phases to avoid the most expensive conflicts.
5. Flexible Export & Reporting
Pain point addressed: Platform data is valuable, but teams need it in their existing workflows (CAD, GIS, proposals).
Solution:
The platform offers multiple export formats and customization options. Users can download KML or Shapefile files, which can be converted to CAD, access utility owner lists for coordination, and generate project insight reports with key findings formatted for pursuits and proposals. For high-volume clients, custom symbology ensures exports match internal standards, including colors, line dashes, and more.
Reporting capabilities:
The system allows filtering by utility type, such as showing only power and water intersections, generating conflict matrices, producing easement requirement summaries, and creating visual documentation suitable for stakeholder presentations.
Used By
Target Customers
Primary AEC Sector:
Civil engineering firms use the platform for feasibility studies, route planning, and design. General contractors rely on it for pre-construction planning and conflict avoidance. EPCs (Engineering, Procurement, and Construction firms) also leverage the platform for integrated project workflows.
Secondary – Infrastructure Owners
Utility companies use it for asset management, undergrounding programs, and corrosion analysis that may require excavation. State DOTs apply the platform to highway projects and right-of-way analysis, while municipal and local entities use it for city projects and broader infrastructure planning.
Tertiary – Specialized Users
Project owners utilize the platform for land acquisition analysis to determine site viability based on utility availability. Developers use it to assess site feasibility for commercial and residential projects.
Trusted by Leading Organisations
Woolpert
Revenue:
$650 Million
Employees
3000
Adopting 4M in Woolpert's project workflow isn't just a tech upgrade - it's commitment to smarter, safer, and more cost-effective engineering
Kimely Horn
Revenue:
$2.8 Billion
Employees
9000+
We use 4M in the proposal, design, and construction phases. We run a map at every stage to ensure we always have real-time utility information.
Operating Locations
Austin, Texas - US headquarters, ~80% of US team, customer-facing operations
Tel Aviv, Israel - R&D headquarters, AI/ML development, most mapping operations
Southern California - Sales presence
Current: 14 of 50 US states fully mapped
Implementation & Onboarding
Important Considerations
Timeline:
Immediate platform access once subscribed
1-hour kickoff call with customer success leader
Training focus: How to draw projects, invite teammates, interpret results
Setup: Login credentials + team invitations
Typical KPIs tracked:
Reduced labor hours on records research
Increased win rates on pursuits (better intelligence = better proposals)
More proposals submitted (research no longer bottleneck)
Avoided conflicts and change orders
Faster feasibility study turnaround
Measurement approach:
Establish baseline metrics at kickoff
Track performance at 3, 6, and 9 months
Provide reports documenting value delivery
Make renewal/expansion decisions data-driven
Security & Privacy
Integrations
ROI & Value
Time Savings (Quantifiable):
Records research: 20-40 hours per project → 2-3 hours
Pursuit preparation: Days of utility intelligence gathering → hours
Site investigation planning: Blind surveys → targeted verification
Proposal volume: Research bottleneck eliminated, more bids submitted
Strategic value:
Faster feasibility decisions enable pursuit of more opportunities
Better proposals increase win rates
Reputation for thorough due diligence attracts clients
Reduced construction risk improves project margins
Enlaye is the AI-native risk platform for general contractors — turning years of project documents into searchable, scenario-ready risk intelligence from bid through handover.

.png)
.avif)

.avif)